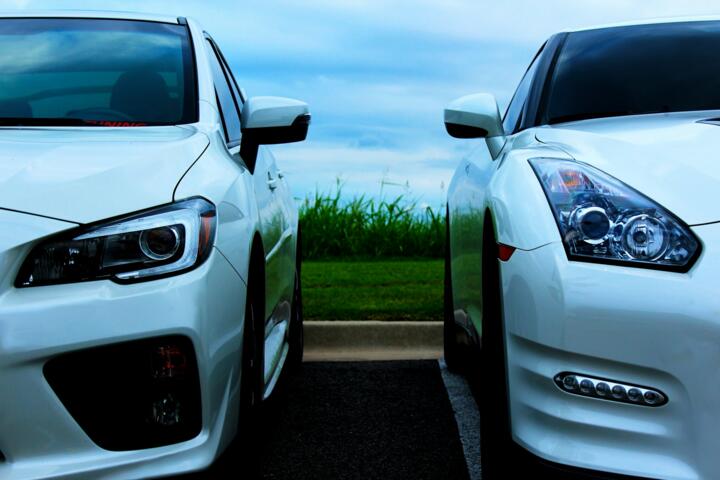
Specs Match, Driving Doesn’t
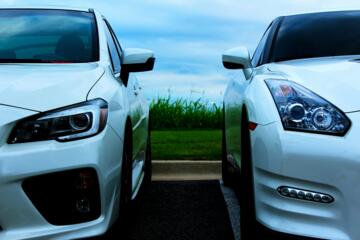
Two cars with matching horsepower can still post different acceleration times because traction and drivetrain mapping differ. A 10% change in tire grip can shift wheelspin and cut real-world 0–60 mph results by more than a tenth, even with similar engine output.
Vehicle type matters more than many buyers realize because the same engine family behaves differently in a sedan versus an SUV. The extra mass, higher center of gravity, and different gearing change how often the transmission hunts and how hard the brakes work.
Real-world testing also shows how fuel economy varies with conditions. The U.S. EPA test cycle is standardized, but real driving often lands below it; many owners see 10–25% lower than the label depending on speed and temperature.
Skip the brochure numbers. They hide tire and calibration effects.
Even within one model line, a “same spec” comparison can fail. For example, a 2.0-liter turbo rated around 250 hp can feel sharper or lazier depending on whether it’s paired with an 8-speed automatic, a dual-clutch, or a continuously variable transmission.
Also, brake feel changes with rotor size and pad compound. Two cars can both claim “four-wheel disc brakes,” yet one uses larger rotors and a different friction material that resists fade longer.
Where Buyers Get Misled
People often treat the spec sheet like a complete map of the driving experience. It isn’t, because the driving feel is mostly the result of systems tuning: suspension damping, steering ratio, brake bias, and throttle response.
One common mistake is assuming two cars with the same 0–60 mph claim will feel identical. That claim is measured on a specific surface with specific tires and temperatures, and it doesn’t include how the car behaves at 30–50 mph passing or during repeated pulls.
Skip the “same horsepower” shortcut. It ignores torque delivery and traction.
Real-world consequences show up quickly. A crossover with softer damping may feel stable on smooth roads but pitch more over expansion joints, which increases cabin noise and can make child-seat positioning less predictable.
Financial consequences follow. If one car uses a higher-friction brake pad that dusts heavily, you may spend more on cleaning and replacement cycles; if another car’s tires wear faster due to wider tread or different compounds, the cost per mile rises.
Reliability and repair frequency can also diverge even when engines match. Different cooling packages, different transmission software, and different wheel/tire loads can change how often parts reach wear limits.
How to Predict the Feel
Start with tires, not engines
Tires are the fastest way to explain why two cars “with equal specs” drive differently. A 225/45R18 all-season tire and a 245-width performance all-season tire can change grip and steering response even if the engine output stays the same.
Look for tire model and size on the window sticker. If one car ships with 19-inch wheels and a low-profile tire, expect harsher impact harshness and more road noise at 70 mph.
In practice, the car with the stickier tire usually shows better launch traction but may wear faster. Many performance-oriented tires can show noticeably higher tread wear after aggressive driving, and replacement intervals can shrink by thousands of miles.
Use a tire tread-depth gauge at purchase. I’ve used a $20 digital caliper on used cars to compare left-to-right wear before negotiating.
Skip the “tire pressure is the same” assumption. Different tire constructions react differently to the same PSI.
Compare suspension tuning details
Suspension hardware can be similar while damping curves differ. Two cars may both use a MacPherson strut front and multi-link rear, yet one uses firmer rebound control that reduces body roll but increases noise over potholes.
Check for adaptive damping or different spring rates. Adaptive systems can switch between modes, but the baseline calibration still affects how the car settles after a bump.
During a test drive, watch the steering wheel after you release it. If the car takes longer to return to center, the alignment and steering geometry are likely different, which changes how the car tracks under braking.
Use your phone’s accelerometer app for a quick sanity check. A version like “Physics Toolbox” can help you compare how quickly the car recovers after a curb strike, though it won’t replace a professional test.
Skip the “it rides fine” verdict. Pay attention to how the suspension behaves after the second bump, not the first.
Read the drivetrain calibration
Transmission type and shift logic can change drivability even with identical engine horsepower. A 2.5-liter turbo paired to an 8-speed automatic may deliver torque smoothly, while the same engine in a different vehicle can be mapped to protect driveline components and reduce heat.
Throttle mapping matters too. Two cars can both hit 60 mph in similar times, yet one may feel delayed because it meters torque gradually to manage traction control.
In practice, the difference shows up during passing. If the car downshifts late at 45 mph, you’ll feel it as a pause before acceleration, even if peak power matches.
Ask for the gear ratio chart if the dealer has it. Many brands publish gear ratios, and you can infer how often the engine stays in its power band.
Skip the “specs match, so it should feel the same” belief. Calibration changes the torque curve you actually use.
Brake hardware and fade behavior
Brake feel is shaped by rotor diameter, pad compound, and brake booster tuning. Two cars can both list “vented front discs,” but one may use larger rotors that reduce thermal stress during repeated stops.
Look for rotor size and pad type in service literature when available. If one car uses a more aggressive pad, it may bite harder initially but wear faster and dust more.
Test braking from 60 to 20 mph on a safe, legal route. Note pedal travel and whether the pedal firms up after the first stop; a consistent pedal usually indicates better thermal stability.
Skip the “ABS light never comes on” check. ABS behavior doesn’t tell you how the brakes handle heat after 6–10 hard stops.
Ownership cost can follow. Higher-performance pads often raise brake replacement frequency, and rotors may need resurfacing sooner if the pad material is harsher.
Steering ratio and alignment effects
Steering feel depends on steering ratio, assist calibration, and tire scrub radius. Two cars with the same wheelbase can still turn differently because one uses a quicker ratio or different caster settings.
Alignment changes how the car tracks under braking and how stable it feels in crosswinds. A car with slightly more toe-in can feel calmer, while another with less toe-in may feel more responsive but wander more.
In practice, you’ll notice it when you drive hands-off for 10–15 seconds on a straight road. If it drifts, the alignment and tire wear pattern are likely off.
Use a tape measure for a simple check. Measure tread depth front-left and front-right; a 2/32 in difference can correlate with pull and uneven wear.
Skip the “alignment is minor” mindset. Small toe changes can alter tire wear cost over 30,000 miles.
Noise, vibration, and cabin practicality
Cabin noise can differ even when engines and tires match. Wind noise depends on mirror design, door seals, and underbody airflow, while road noise depends on tire tread pattern and wheel size.
At 70 mph, a 19-inch wheel with a low-profile tire often produces more audible impact noise than a 17-inch setup. That doesn’t show up in horsepower numbers, but it affects long trips and child-seat comfort.
Check rear-seat space for child-seat compatibility. Measure the distance from the seat cushion to the backrest and check whether the seatbelt buckle location interferes with a forward-facing child seat.
Bring the child seat manual if you’re switching brands. Some seats require specific belt routing angles, and the wrong belt geometry can make installation harder.
Skip the “it fits on paper” assumption. Try the seat in the car, then tighten and tug at the belt path.
Fuel economy and real costs
Fuel economy differences often come from vehicle mass, aerodynamics, rolling resistance, and drivetrain losses. A 1,500-lb difference in curb weight can shift highway consumption by several mpg, especially at steady 75 mph.
Use EPA combined mpg as a baseline, then apply a correction based on your route. If your commute includes 20 minutes of stop-and-go, expect lower mpg than a highway-only route.
For example, a gasoline car rated 30 mpg combined might land closer to 22–27 mpg in cold weather. Temperature affects engine warm-up time and tire rolling resistance.
Track fuel cost per mile for 3–4 fill-ups. If one car averages 25 mpg and another averages 22 mpg, the 13.6% difference shows up quickly at $3.50 per gallon.
Skip the “label mpg is what I’ll get” expectation. Your driving pattern writes the final number.
EV range and charging limits
EVs with similar battery size can drive differently because of thermal management and efficiency at speed. A 75 kWh pack in one vehicle might deliver a different highway range than another due to aerodynamics and drivetrain efficiency.
Charging capability matters too. If one car supports 250 kW peak charging and another tops out around 150 kW, the time to add 100 miles of range can differ by 15–30 minutes on a busy fast charger.
In practice, range drops faster at 80 mph than at 65 mph. Wind, elevation, and HVAC settings can swing usable range by 10–25% on the same route.
Check the onboard charger rating. A 7.2 kW AC charger fills slower than a 11 kW unit, which changes overnight planning for commuters.
Skip the “battery size equals range” equation. Efficiency and charging curve decide the trip math.
Warranty, maintenance, and resale
Two cars with equal specs can still differ in ownership cost because maintenance schedules and wear items vary. Brake pads, tires, and transmission service intervals depend on how the car loads the drivetrain.
Check warranty coverage for powertrain and emissions components. A longer powertrain warranty can reduce risk if the transmission or turbocharger needs work, but it doesn’t cover tires or routine wear.
Look at typical depreciation patterns using historical pricing data from reputable sources. If one model retains value better, the resale gap can offset higher fuel or insurance costs.
Ask about scheduled service items at 30,000 and 60,000 miles. Some turbo engines require more frequent oil changes under severe service, and ignoring that can shorten component life.
Skip the “free maintenance covers everything” belief. It often excludes tires, brake pads, and certain inspections.
Mini Case Studies
Fleet sedans with same output
A delivery company bought two compact sedans with similar 2.0-liter turbo output around 250 hp. The first arrived with 18-inch tires and a softer damping tune; the second used 19-inch wheels and firmer calibration.
They tracked costs over 18 months and 28,000 miles. Tire replacement happened at 32,000 miles on the 19-inch setup versus 41,000 miles on the 18-inch car, a difference of roughly 9,000 miles per set.
They also saw brake dust complaints and more frequent pad changes. The firmer pad compound wore faster, and brake service averaged about $180 more per vehicle over the period, including labor.
Skip the assumption that horsepower explains wear. Wheel size and pad compound drove the cost gap.
EVs with similar batteries
A small business compared two EVs with battery packs in the 70–80 kWh range for a 120-mile daily route. Both listed similar EPA combined range, but one had higher highway efficiency and a faster charging curve.
They charged at a 150 kW DC station during lunch. The faster-charging car added enough energy for the return trip in about 22 minutes, while the other took about 35 minutes, which reduced schedule slack.
Over 5 days per week, the extra 13 minutes per day equaled about 43 hours per year of lost time. Even if the company didn’t bill that time, it affected driver availability and route planning.
They also noted HVAC settings mattered. At 35°F, usable range dropped more than the label suggested, and the slower-charging car needed a top-up more often.
Checklist for a Fair Comparison
| What to compare | Why it changes driving | What to look for on the spec sheet | Quick test |
|---|---|---|---|
| Tire size and model | Grip and road noise | Example: 225/45R18 vs 245/40R19 | Listen at 70 mph; note steering response |
| Brake rotor size | Heat handling and pedal feel | Vented front discs; rotor diameter if listed | Repeat 60→20 mph stops; watch pedal consistency |
| Transmission type | Shift timing and torque delivery | 8-speed auto vs DCT vs CVT | Passing test at 45 mph; note downshift delay |
| EV charging limits | Time to add range | Peak kW and AC charger rating | Plan a 100-mile top-up; compare minutes |
| Ownership costs | Tires, brakes, depreciation | Warranty terms; service intervals | Estimate cost per mile from tire and brake wear |
Common Mistakes and Fixes
Assuming identical engines match
Why it happens: buyers focus on horsepower and torque because those numbers are easy to compare. Impact: you miss differences in shift logic, throttle mapping, and traction control strategy.
How to avoid it: drive both cars in the same gear and speed range. Do a 40–60 mph pull and note whether the car waits before downshifting.
Skip the “it’s the same motor” argument. The software decides how it behaves.
Ignoring tire and wheel package
Why it happens: tire size is buried in trim details, and many listings omit the tire model. Impact: road noise and steering response can change more than a 20 hp difference.
How to avoid it: compare wheel diameter and tire aspect ratio. If one car uses 19-inch wheels with a 40-series tire, expect more impact harshness over broken pavement.
Leave the dealer lot with tire model names written down. You’ll need them later.
Over-trusting EPA mpg
Why it happens: the label is standardized, so it feels like a promise. Impact: cold starts, short trips, and high-speed driving can cut mpg by 10–25% versus label expectations.
How to avoid it: estimate your route mix. If your commute is 60% highway at 75 mph, use a higher correction than for 55 mph suburban driving.
Skip the “combined mpg” only approach. Break it into your actual speeds.
Not checking brake fade risk
Why it happens: most test drives include one hard stop, not repeated braking. Impact: a car that feels fine once can fade after multiple stops on a downhill grade.
How to avoid it: ask about rotor size and pad type, then do two or three firm stops in sequence. If the pedal changes after the second stop, the thermal margin is smaller.
Bring a passenger to watch pedal travel. You’ll catch changes you miss alone.
Forgetting child-seat fit
Why it happens: seatbelt routing and buckle placement aren’t obvious from photos. Impact: a seat that installs easily in one car can be awkward in another, which affects safety and daily usability.
How to avoid it: install your child seat in both cars. Check for enough clearance around the belt path and whether the top tether anchors are reachable.
Skip the “we’ll figure it out later” plan. Installation friction becomes a daily annoyance.
FAQ
Can two cars with same hp feel different?
Yes. Horsepower is only peak output, while drivability depends on torque delivery, transmission calibration, and traction control. Tire grip and wheel size also change how quickly torque reaches the road. Even if both cars hit similar 0–60 mph times, one can feel delayed during passing because it holds gears longer or meters torque more conservatively. If you want a fair comparison, test the same speed range, like 40–60 mph, and note downshift timing and pedal response.
Why does one car get worse mpg?
Fuel economy changes with rolling resistance, aerodynamics, and drivetrain losses. Tire width and tread compound influence rolling resistance, and wheel size can increase aerodynamic drag. Transmission behavior matters too: a car that stays in a lower gear for response can raise engine rpm and reduce mpg. Temperature and trip length also matter; short trips keep the engine in warm-up mode longer. Compare cars using your route mix, not only the combined EPA number.
Do brake specs change more than people expect?
Brake feel and fade resistance depend on rotor size, pad compound, and brake booster tuning. Two cars can both list disc brakes but still differ in pedal travel, initial bite, and how quickly the pedal firms up after repeated stops. Pad materials can also affect dust and wear rate, which changes ownership cost. If you drive in hilly areas, test repeated braking and look for signs of pedal change after the second or third stop.
How can I compare EV range fairly?
Compare efficiency at your speeds and charging limits, not only battery size. Highway driving at 75–80 mph typically reduces usable range more than city driving. Charging capability matters because the charging curve slows as the battery fills; peak kW ratings don’t translate directly into minutes for every trip. Check both DC peak power and AC onboard charger rating. Then plan a realistic top-up, like adding enough for 120 miles, at the charger power you actually use.
What should I check before buying two similar trims?
Verify the tire model and wheel size, not just the trim name. Confirm brake rotor and pad details when available, and check whether the transmission type changes across trims. For family use, test child-seat installation and check rear-seat belt geometry. Also compare warranty terms for powertrain and emissions components, plus scheduled service items at 30,000 and 60,000 miles. Finally, estimate depreciation and insurance differences using actual quotes, since those costs can outweigh small fuel economy gaps.
Author's Insight
Specs describe components, but the road feel comes from how those components are tuned together. Tire model, wheel size, damping curves, and brake pad friction often explain more than a 10–20 hp difference. I’ve seen the same engine family behave differently across body styles because gearing, cooling, and software targets change. Treat “equal specs” as a starting point, then verify the package with a short, repeatable test route.
What to Remember
Two cars can list equal horsepower and still drive differently because tires, suspension tuning, drivetrain calibration, and brake hardware change traction, pedal feel, and noise. Use a comparison checklist: tire model, wheel size, brake details, transmission type, and for EVs, charging limits and onboard charger rating.
Next step: schedule a test drive that repeats the same maneuvers in both cars—40–60 mph passing, two or three firm stops, and a straight-road tracking check. Write down tire sizes, note pedal travel changes, and compare cabin noise at 70 mph.
Limits: you can’t fully predict every outcome like long-term reliability from specs alone. If you’re buying used, request service records and inspect tires, brakes, and suspension for uneven wear.
Seek professional help if you notice persistent pulling, vibration under braking, or warning lights after the test drive. A pre-purchase inspection and a scan tool read can catch issues that a short drive won’t reveal.