The Evolution of Behavioral Risk Assessment
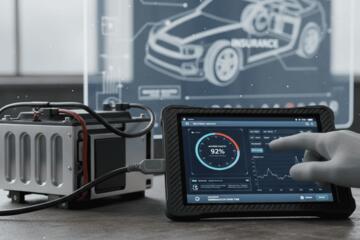
For decades, insurance premiums were calculated using broad actuarial buckets: age, zip code, marital status, and credit score. Telematics disrupts this "guilt by association" model by installing a digital witness in your vehicle. Whether via a plug-in OBD-II device or a mobile app like State Farm’s Steer Clear, the technology tracks high-resolution data points that correlate directly with crash probability.
In practice, this means a 22-year-old male—traditionally the highest-risk demographic—can prove his individual safety through smooth braking and consistent speed limit adherence. According to Arity, a transportation data analytics company, the top 10% of safest drivers are roughly 2.5 times less likely to get into an accident than the average driver. By opting into telematics, these individuals stop subsidizing the risks of their more reckless peers.
The market is shifting rapidly. Statista reports that the global automotive telematics market is projected to exceed $150 billion by 2030. This isn't just a niche feature; it is becoming the industry standard for major carriers like Progressive, Geico, and Allstate.
Critical Pain Points in Modern Premium Calculations
The primary frustration for modern drivers is "demographic profiling." You might have a clean driving record for twenty years, but if you live in a high-crime zip code or have a low credit score, your rates remain high. Traditional insurance ignores the fact that your car might sit in a locked garage 23 hours a day.
Many policyholders also struggle with "transparency gaps." Without telematics, a premium hike feels arbitrary. You aren't told why your rate went up, only that it did. This lack of feedback prevents drivers from improving their habits. Furthermore, low-mileage drivers—such as remote workers—often overpay by 30% to 50% because traditional policies assume a standard 12,000-mile annual commute.
In real-world scenarios, a sudden "hard braking" event to avoid a stray animal can be flagged as a negative behavior by lower-quality telematics algorithms. Without an expert understanding of how these systems weigh different events, drivers often find themselves frustrated by "unfair" score drops that lead to lost discounts.
Strategic Optimization of Driving Data
Understanding the "Hard Braking" Threshold
Most telematics programs, such as Progressive Snapshot, define a hard braking event as a decrease in speed of more than 7–10 mph per second. To maintain a high score, you must extend your following distance. Increasing the gap between you and the car ahead from two seconds to four seconds provides the buffer needed to slow down gradually, preserving your discount.
The Midnight Curse and Risk Mapping
Statistically, the hours between 12:00 AM and 4:00 AM are the most dangerous due to fatigue and the prevalence of impaired drivers. Nationwide’s SmartRide specifically monitors these "high-risk hours." If your job requires late-night commutes, a telematics-based policy might actually increase your costs. In this case, switching to a standard "Pay-Per-Mile" model like Metromile (now part of Lemonade) is more effective, as it tracks volume rather than the specific time of day.
Leveraging Mobile App Sensitivity
If you use a phone-based tracking app like Allstate’s Drivewise, the gyroscope and accelerometer are hyper-sensitive. A common mistake is leaving the phone loose in a cup holder, where it slides and mimics aggressive cornering. Securing the device in a fixed mount ensures the data reflects the car's actual movement, not the phone's vibration.
Optimization of Smooth Acceleration
Aggressive starts are often flagged because they correlate with "jackrabbit" driving. By keeping your RPMs low and accelerating at a steady rate, you demonstrate "predictable" behavior. Data from Cambridge Mobile Telematics suggests that drivers who receive real-time feedback through app alerts reduce their distracted driving by an average of 20% within the first month.
Route Selection and Risk Profiling
Advanced telematics also looks at where you drive. Navigating through high-traffic urban intersections is riskier than taking a slightly longer highway route. Some insurers use "Risk Maps" to evaluate your daily path. Choosing routes with fewer left-hand turns across traffic can subtly improve your internal safety score over time.
Monitoring Device Health and Connectivity
If your OBD-II device loses connection, the "missing data" is often treated as a neutral or slightly negative variable. Regularly checking the app to ensure your trips are being logged correctly prevents a sudden loss of the "participation discount," which is usually around 5% to 10% just for plugging the device in.
Mini-Case Examples of Telematics Implementation
Case 1: The Remote Worker’s Savings
Subject: Sarah, a graphic designer in Seattle.
Problem: Paying $180/month for a standard policy despite driving less than 3,000 miles per year.
Action: Switched to Metromile pay-per-mile insurance.
Result: Her base rate dropped to $40/month plus 6 cents per mile. Her average monthly bill fell to $58, a 67% reduction in annual insurance costs.
Case 2: The High-Risk Youth Correction
Subject: Mark, a 19-year-old college student.
Problem: Initial quotes exceeded $400/month due to age and lack of credit history.
Action: Enrolled in State Farm’s Steer Clear program, which requires 30 days of monitored driving and educational modules.
Result: By maintaining a "Gold" safety rating, Mark secured a 15% discount on top of his "Good Student" discount, bringing his premium down to a manageable $280/month.
Telematics Program Comparison
| Feature | Progressive Snapshot | State Farm Drive Safe | Metromile (Lemonade) |
|---|---|---|---|
| Primary Metric | Braking, Speed, Time of Day | Braking, Speed, Cornering | Total Mileage |
| Hardware | App or OBD-II Device | Mobile App + Bluetooth Tag | OBD-II Device |
| Potential Discount | Up to 30% | Up to 30% | Unlimited (Pay-per-mile) |
| Risk of Rate Hike | Yes (in some states) | Low (mostly discounts) | No (standard mileage rate) |
| Trial Period | One policy term | Continuous | Continuous |
Common Pitfalls and How to Avoid Them
One major mistake is "Phone Handling" errors. Many apps detect when the screen is unlocked or the phone is moved while the vehicle is in motion. Even a passenger using your phone can trigger a "Distracted Driving" penalty if the app is active. To avoid this, ensure your phone is connected to Bluetooth for hands-free operations and tell passengers not to fiddle with the device being used for tracking.
Another error is ignoring the "Last Trip" feedback. Most apps provide a map showing exactly where a "hard brake" or "speeding" event occurred. By reviewing these daily, you can identify specific intersections or road segments where you tend to drive more aggressively and consciously adjust your behavior in those zones.
Lastly, drivers often forget to "unpair" or categorize trips. If you are a passenger in a Lyft or a bus, the app might accidentally record the trip as your own driving. If the Lyft driver is aggressive, your score suffers. Always check your trip log weekly to re-classify or delete trips where you were not the driver.
FAQ
Can my insurance company use telematics data to deny a claim?
Generally, no. Telematics data is primarily used for premium pricing. However, in cases of severe fraud or criminal investigations, insurers may use the data to verify the time and location of an accident. Always check your specific policy’s data privacy disclosure.
Does telematics track my location at all times?
Yes, most systems use GPS to determine the context of your driving (e.g., were you speeding in a school zone or on a highway?). If you are highly sensitive about location privacy, telematics may not be the right choice for you.
What happens if I have to slam on the brakes to avoid a crash?
A single hard-braking event rarely ruins a discount. Insurers look for patterns of behavior. One emergency stop is viewed as a statistical outlier, whereas ten hard stops in a week suggest tailgating or lack of focus.
Can my rates actually go up?
In most states and with most carriers (like State Farm), telematics is "discount only." However, Progressive and some others reserve the right to increase premiums for high-risk drivers based on the data collected during the monitoring period.
Will the device drain my car battery?
OBD-II devices pull a very small amount of power. However, in older vehicles or cars left sitting for more than two weeks, it can contribute to battery drain. If you plan to leave your car at the airport for a month, it is often wise to notify your agent and unplug the device.
Author’s Insight
In my experience consulting with fleet managers and individual policyholders, the psychological shift is more valuable than the discount itself. When you know you are being "graded," you naturally become a more defensive driver. I personally used an OBD-II tracker for six months and realized I was consistently taking a high-risk left turn on my commute that I could easily replace with a safer right-hand loop. That minor adjustment not only lowered my premium by 22% but likely saved me from a future collision.
Conclusion
Telematics represents the end of "blanket pricing" in the automotive insurance industry. By focusing on smooth deceleration, avoiding late-night transit, and monitoring mileage via services like Metromile or Snapshot, drivers can regain control over their financial liabilities. The data is clear: those who embrace transparency in their driving habits are rewarded with significantly lower overhead and a safer daily commute. Actionable next step: Audit your annual mileage; if it is under 8,000 miles, a telematics-based pay-per-mile plan should be your immediate priority.